Customer Lifetime Value: How to Calculate and Improve It
Customer Lifetime Value: How to Calculate and Improve It
Customer lifetime value (CLV) measures the total net profit a business can expect from an individual customer throughout their entire relationship with the company.
For ecommerce brands, this metric transforms how you allocate retention budget, prioritise customer segments, and build lifecycle flows that actually drive revenue. Yet most brands calculate it once, file it away, and never use it to make real decisions.
The challenge isn't the formula itself. It's understanding which formula suits your business model, how to extract the data accurately from your platform, and how to translate that number into retention strategies that make CLV growth inevitable.
This guide walks you through the essential CLV calculations, shows you where most ecommerce brands miscalculate their customer value, and provides the retention levers you can pull in your Klaviyo account to shift those numbers upward. You'll learn the basic formula, the predictive models that forecast future value, and the specific tactics that increase purchase frequency and customer lifespan without inflating acquisition costs.
What Customer Lifetime Value Actually Tells You
Customer lifetime value represents the total profit you can expect from a single customer account. It's not revenue. It's not the sum of their orders. It's the net profit figure that remains after you subtract product costs, fulfilment expenses, and ongoing service investments.
Most ecommerce brands focus on conversion rate and average order value. Those metrics matter for short-term wins. CLV matters for long-term survival.
When you know the lifetime value of your customers, you know how much you can afford to spend acquiring them. You know which segments deserve VIP treatment. You know which product categories drive repeat purchases and which ones attract one-time buyers.
Why CLV Is More Valuable Than Acquisition Metrics
Acquisition metrics tell you what happened yesterday. CLV tells you what happens tomorrow.
Brands that optimise for first-purchase conversion often build unsustainable business models. They spend heavily to acquire customers, celebrate the initial sale, then watch those customers disappear without making a second purchase. The unit economics look appealing until you calculate the true customer value across their entire relationship.
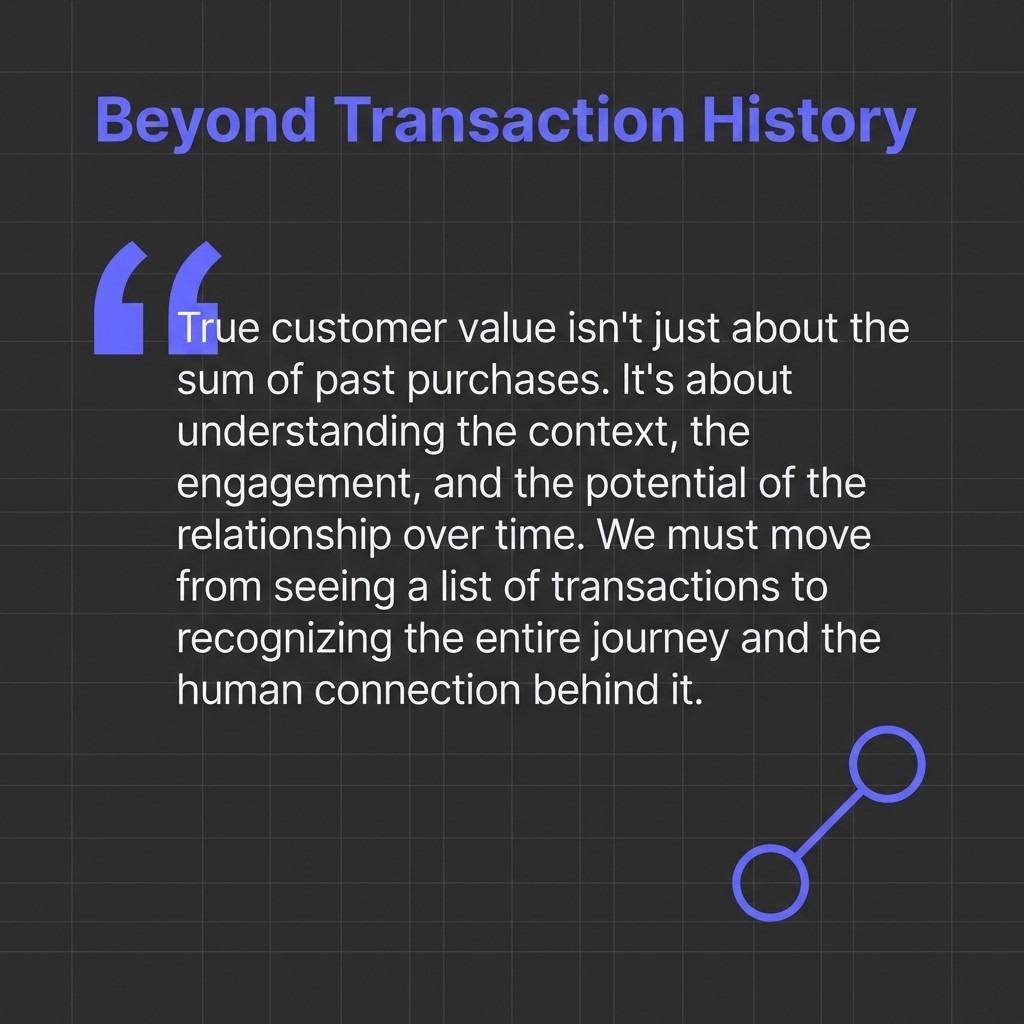
A customer's value extends beyond their transaction history and should reflect the true nature of the relationship. This shift in perspective changes how you approach retention marketing. Instead of pushing for immediate conversions, you build flows that nurture long-term engagement and repeat purchase behaviour.
The Retention Equation That Drives CLV Growth
Three variables control your customer lifetime value: average purchase value, purchase frequency, and customer lifespan. Improve any of these metrics and your CLV increases proportionally.
The most effective retention strategies target all three simultaneously. Post-purchase flows increase order value through cross-sells. Educational campaigns increase purchase frequency by demonstrating product benefits. Loyalty programmes extend customer lifespan by creating switching costs that discourage churn.
Each touchpoint in your retention flows should explicitly target one of these three variables. If a campaign doesn't increase purchase value, frequency, or lifespan, it's not contributing to CLV growth.
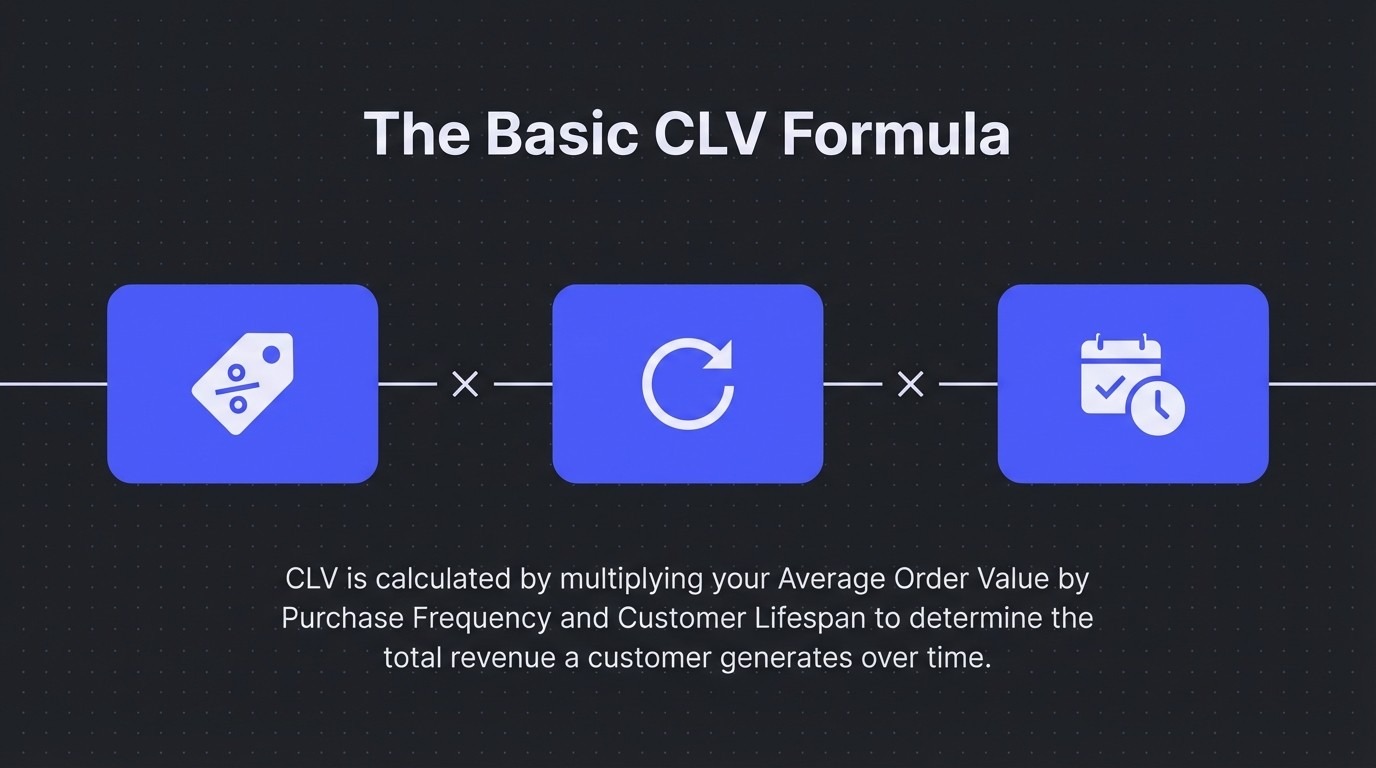
How to Calculate Customer Lifetime Value Using the Basic Formula
The fundamental CLV calculation is Average Order Value × Purchase Frequency × Customer Lifespan. This simple formula provides a baseline estimate that works for most ecommerce brands.
Start by calculating your average order value. Pull your total revenue from the past 12 months and divide by the number of orders placed during that period. This gives you the typical transaction value for your customer base.
Next, determine purchase frequency. Take the total number of orders from the past year and divide by the number of unique customers who made those purchases. This shows how many times the average customer buys from you annually.
Defining Customer Lifespan for Ecommerce Brands
Customer lifespan is the trickiest variable to calculate. It represents the average duration a customer continues purchasing from your store before they stop entirely.
Calculate it by identifying all customers who made their first purchase three years ago. Count how many of those customers made another purchase within the past 90 days. The percentage still active represents your retention pattern, which you can convert into an average lifespan figure.
For subscription brands, customer lifespan is simpler. Take the reciprocal of your churn rate. If 5% of subscribers cancel each month, your average customer lifespan is 20 months.
Step-by-Step CLV Calculation Example
Let's calculate CLV for a fictional supplement brand. Their average order value is £45. Customers purchase 3.2 times per year on average. The typical customer continues buying for 2.5 years before they lapse.
The calculation: £45 × 3.2 × 2.5 = £360 customer lifetime value.
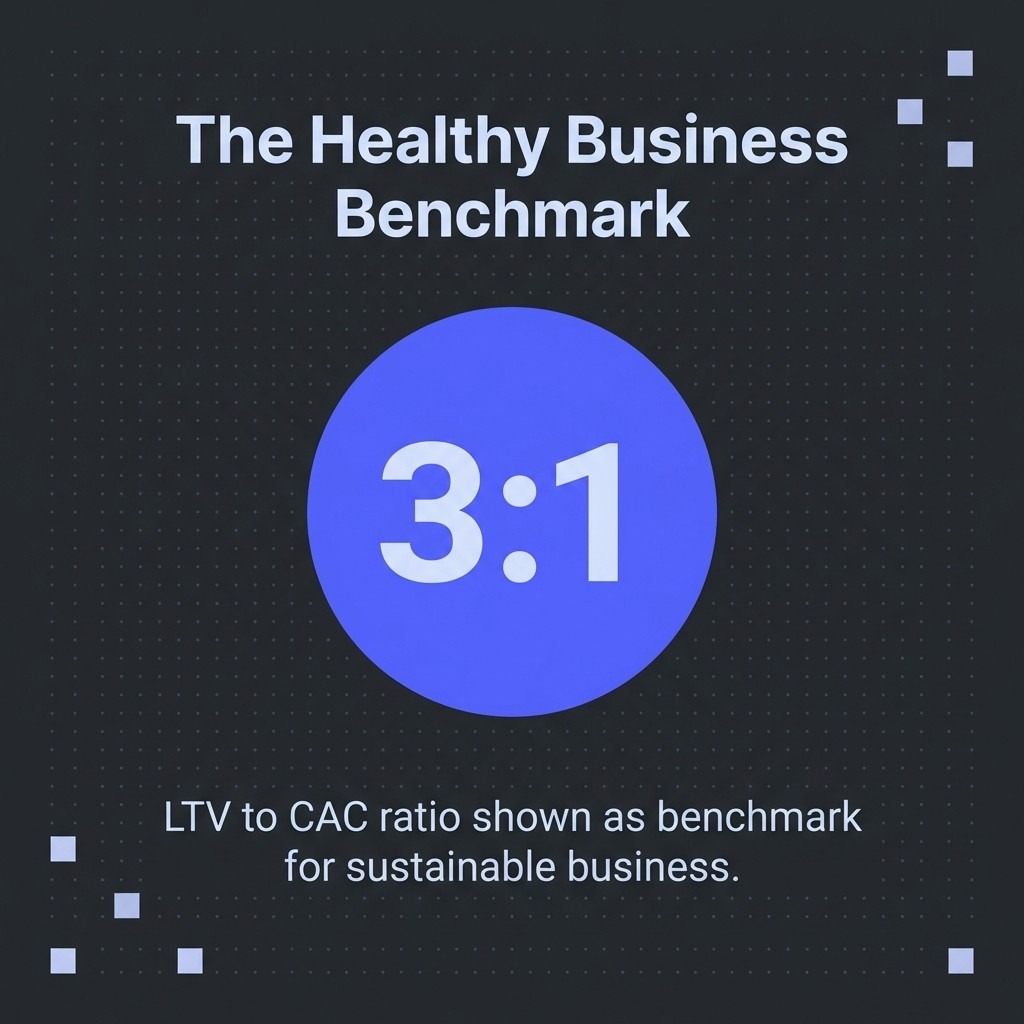
This means each new customer acquisition is worth £360 in gross profit contribution over their relationship with the brand. If customer acquisition cost exceeds £360, the business operates at a loss. If CAC sits below £120, the business achieves a healthy 3:1 LTV:CAC ratio.
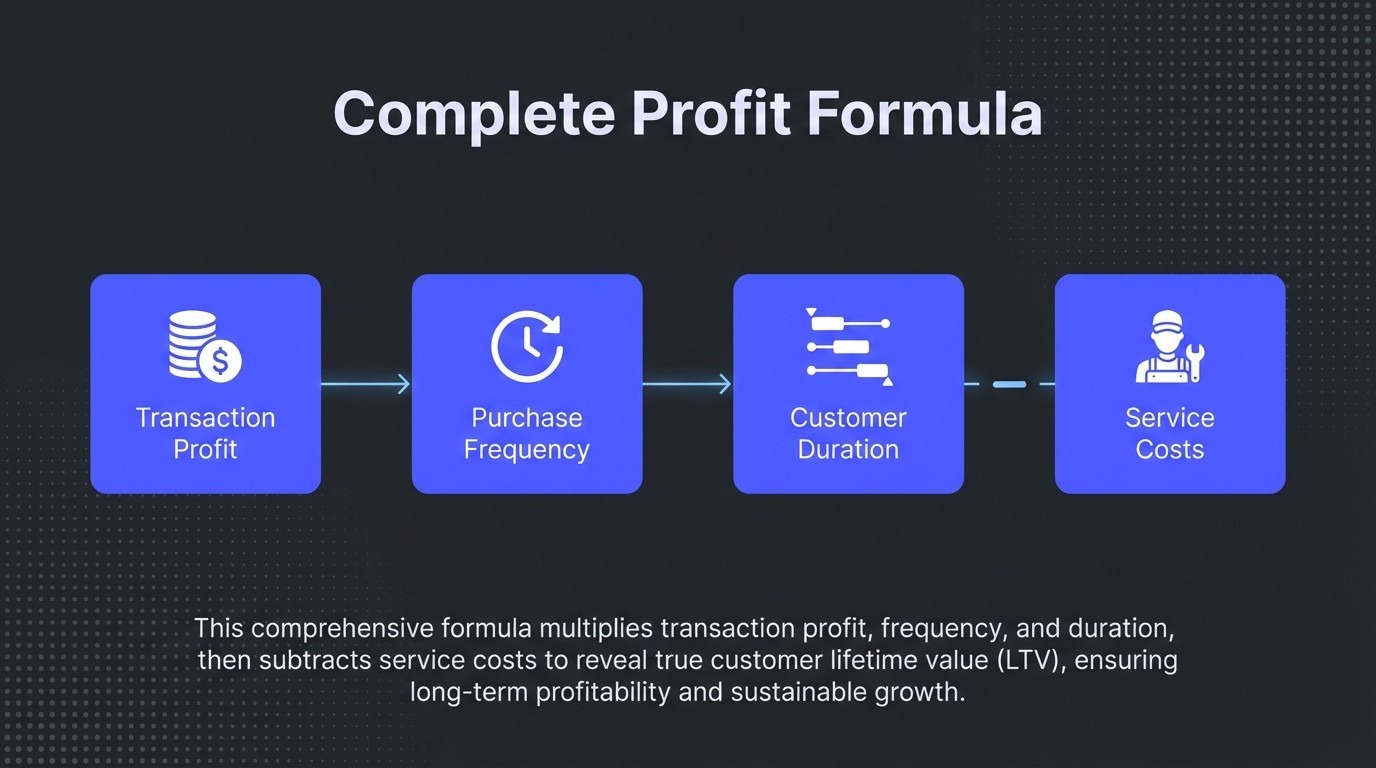
Advanced CLV Formulas That Account for Profit Margins
The basic CLV formula uses gross revenue figures. A more comprehensive formula accounts for profit margins and ongoing costs: LTV = (Average Transaction Profit) × (Annual Purchase Frequency) × (Expected Relationship Duration in Years) - (Ongoing Service Costs).
This adjustment transforms CLV from a revenue metric into a true profitability measure. It reveals whether your retention marketing investments actually generate positive returns.
Calculate average transaction profit by subtracting cost of goods sold, fulfilment expenses, payment processing fees, and platform costs from your average order value. This figure represents the actual profit contribution per transaction.
Incorporating Discount Rate for Present Value Analysis
Money received three years from now is worth less than money received today. The discount rate accounts for this time value of money.
Apply a discount rate by multiplying future cash flows by a discount factor. If you use a 10% annual discount rate, a £100 profit received three years from now has a present value of approximately £75.
Most ecommerce brands can skip this complexity unless they're presenting CLV figures to investors or conducting detailed financial analysis. For day-to-day retention optimisation, the basic formula provides sufficient accuracy.
When to Use Gross Margin in Your CLV Calculation
Include gross margin when you need to evaluate marketing spend efficiency. If your CLV calculation doesn't subtract product costs, you'll overestimate how much you can afford to spend on acquisition and retention.
Calculate gross margin per order by subtracting cost of goods sold from average order value, then dividing by average order value. A product that sells for £50 with £20 COGS has a 60% gross margin. This means only £30 of each sale contributes to covering marketing, operations, and profit.
Multiply your basic CLV figure by your gross margin percentage. A £360 CLV with 60% gross margin becomes £216 in actual profit contribution. This adjusted figure should guide your retention budget allocation.
Predictive vs Historical CLV Models
Historical CLV calculates value based on past customer behaviour. Predictive CLV forecasts future value using customer data, behavioural patterns, and statistical models.
Historical models work well for established brands with years of transaction data. You simply calculate actual revenue generated by cohorts of customers over defined periods. This approach is accurate but backward-looking.
Predictive models use machine learning algorithms to estimate future customer behaviour. They analyse dozens of variables, including purchase recency, frequency, monetary value, product preferences, engagement metrics, and demographic data.
Building a Predictive CLV Model for Ecommerce
The most accessible predictive approach uses RFM analysis: recency, frequency, and monetary value. Segment customers based on these three dimensions, then calculate historical CLV for each segment.
New customers who match the behavioural profile of high-value segments receive predicted CLV scores based on their segment's historical performance. This allows you to identify high-potential customers early in their lifecycle.
SaaS companies typically use formulas like Average Revenue Per Account (ARPA) × Gross Margin × Customer Lifetime (1/Churn Rate). Subscription ecommerce brands can adapt this model by treating subscription revenue separately from one-time purchases.
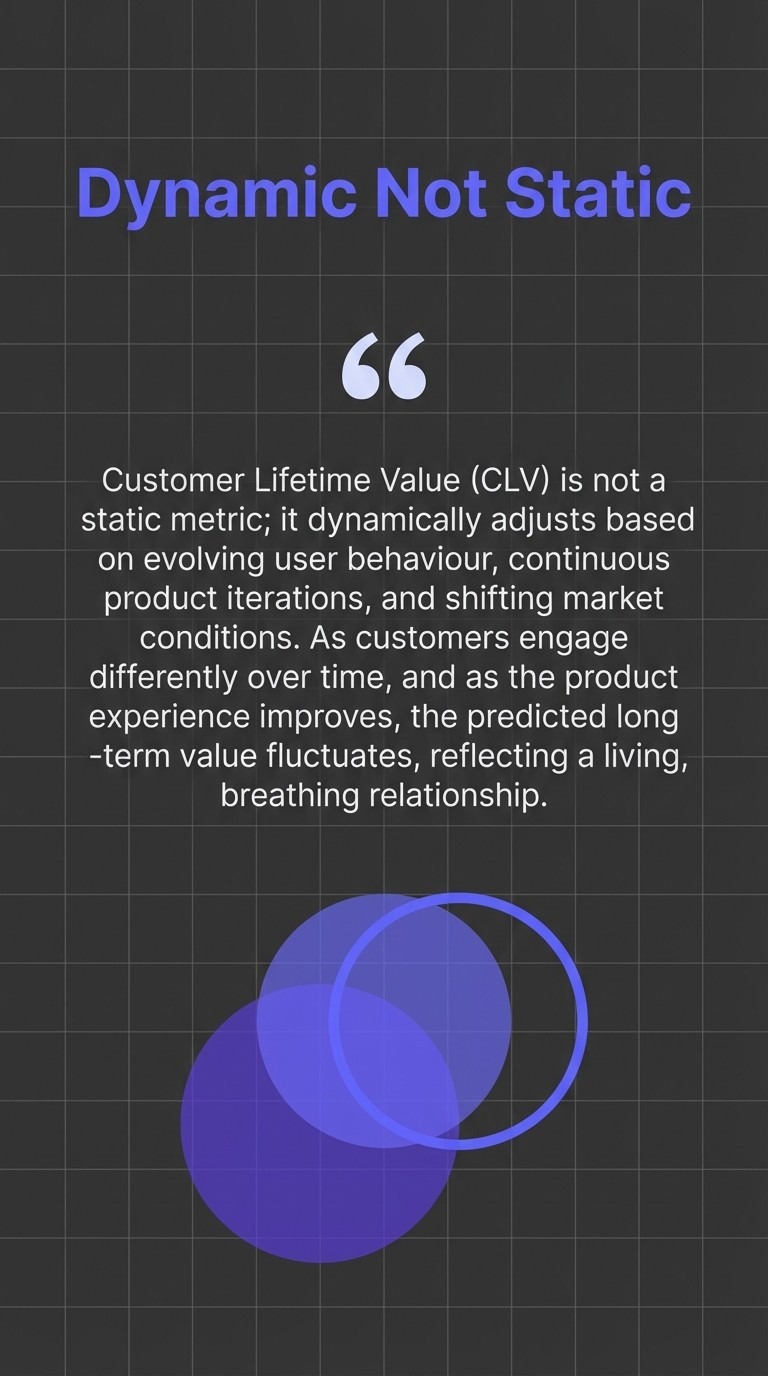
Why Dynamic CLV Matters More Than Static Calculations
CLV is not fixed; it dynamically adjusts based on changes in user behaviour, product feature iterations, and fluctuations in market conditions. Your retention strategies should respond to these shifts in real time.
Recalculate CLV quarterly at minimum. Track changes in the three core variables: average order value, purchase frequency, and customer lifespan. When you spot negative trends, diagnose which retention flows are underperforming and which customer segments are churning faster than expected.
The brands that win in retention treat CLV as a living metric. They build dashboards that track it continuously. They set alerts when segment-level CLV drops below thresholds. They test retention tactics and measure impact on customer lifespan within weeks, not quarters.
Key Metrics That Drive Customer Lifetime Value
Three primary metrics control CLV: average purchase value, purchase frequency rate, and customer lifespan. Secondary metrics like churn rate, retention rate, and gross margin influence these primary drivers.
Track these metrics at both the aggregate level and the segment level. Your VIP customers exhibit different patterns than first-time buyers. Your subscription customers behave differently than one-time purchasers.
The retention opportunities become visible when you analyse metric variations across segments. If high-value customers purchase 8 times per year but new customers purchase only 1.5 times per year, you've identified a clear retention gap to address.
Average Purchase Value and How to Increase It
Average purchase value (APV) is total revenue divided by number of transactions. Increasing APV directly increases CLV without requiring customers to buy more frequently or remain active longer.
The fastest path to higher APV is post-purchase upsells. Send automated flows after order confirmation that recommend complementary products. Offer bundle deals that increase cart value. Create free shipping thresholds that encourage customers to add one more item.
Product recommendations in your flows should be personalised based on purchase history. Customers who buy protein powder should receive supplement stacks. Customers who buy skincare should receive the complete routine. Generic recommendations waste the opportunity.
Purchase Frequency Rate and Retention Triggers
Purchase frequency measures how many times per year the average customer buys from you. Increasing frequency is the most powerful CLV lever for most ecommerce brands.
Build replenishment flows for consumable products. Calculate the typical time between purchases for each product category, then send reminder campaigns 7 days before customers likely run out. This single flow can increase purchase frequency by 15-25% for brands with consumable inventory.
Educational content increases purchase frequency by demonstrating product benefits customers might not discover independently. If you sell cooking equipment, teach recipes. If you sell fitness equipment, share workout programmes. Engaged customers buy more frequently than passive customers.
Customer Lifespan and Churn Rate Impact
Customer lifespan is the duration between first and last purchase. Extending lifespan even slightly produces dramatic CLV increases because it multiplies across all future purchase cycles.
Win-back flows target customers approaching lapse thresholds. Define your lapse period as 1.5x your average purchase cycle. If customers typically reorder every 60 days, trigger win-back campaigns at day 90. Offer incentives that address the likely reason for disengagement.
Churn rate is the inverse of customer lifespan. Different customer groups exhibit significant differences in value characteristics, making segment-specific calculations essential. Calculate churn rates by cohort and segment to identify which customer groups need targeted retention interventions.
The LTV:CAC Ratio and What It Reveals About Business Health
A healthy LTV to Customer Acquisition Cost (CAC) ratio of 3:1 is the benchmark for a sustainable business model. This means you generate £3 in lifetime value for every £1 spent acquiring the customer.
Calculate CAC by dividing total marketing spend by the number of new customers acquired in the same period. Include all advertising costs, agency fees, creative production, and attribution platform costs.
Ratios below 3:1 signal inefficient growth. You're spending too much on acquisition relative to the value generated. Ratios above 5:1 might indicate you're underspending on acquisition and leaving growth opportunities on the table.
How to Improve Your LTV:CAC Ratio
Two paths improve the ratio: increase LTV or decrease CAC. Increasing LTV through retention marketing is typically more profitable than optimising acquisition costs.
Start with welcome flows. New customers who engage with your welcome series purchase more frequently and remain active longer than customers who ignore these emails. Test different welcome flow structures, measure impact on 90-day repeat purchase rate, and iterate until you find the pattern that maximises early lifecycle engagement.
Reduce CAC by improving conversion rates and refining audience targeting. Better landing pages and product pages convert traffic more efficiently. Tighter audience segments reduce wasted ad spend. But these optimisations have natural limits. LTV improvements through retention marketing compound over years.
Segment-Level LTV:CAC Analysis
Calculate LTV:CAC ratios for different customer segments. Your email-acquired customers might show a 6:1 ratio whilst your paid social customers show 2:1. This analysis reveals which acquisition channels deliver sustainable customers and which channels attract deal-seekers who never return.
Allocate retention budget based on segment economics. High-LTV segments justify aggressive retention investments. Low-LTV segments might need lighter-touch automation. The goal is positive ROI on retention spend, not equal treatment across all customers.
Track how retention initiatives impact segment-level ratios. If your VIP programme increases LTV by 40% for participating customers, calculate the programme cost and determine whether it generates positive returns. This data-driven approach to retention investment prevents wasteful spending on tactics that feel good but don't move metrics.
Strategies to Increase Customer Lifetime Value
Increasing CLV requires systematic improvements across the entire customer lifecycle. Focus on the three core drivers: average purchase value, purchase frequency, and customer lifespan.
The most effective approach combines quick wins with long-term structural improvements. Quick wins include optimising existing flows and fixing obvious retention gaps. Structural improvements include building new lifecycle campaigns and implementing customer success programmes.
Prioritise initiatives based on expected impact and implementation effort. Fixing a broken win-back flow might increase CLV by 8% in 30 days. Building a sophisticated loyalty programme might increase CLV by 15% over 12 months. Both initiatives matter, but they serve different strategic timeframes.
Retention Flows That Increase Purchase Frequency
Post-purchase flows should extend beyond the standard thank-you email. Build a series that educates customers on product usage, shares complementary products, and encourages reviews. This engagement increases the likelihood of a second purchase.
Browse abandonment flows recover customers who viewed products but didn't add them to cart. These flows typically convert at lower rates than cart abandonment but they capture a much larger audience. For brands with long consideration cycles, browse abandonment can drive significant incremental revenue.
Replenishment reminders work brilliantly for consumable products. Calculate days between purchases for each product category, then trigger automated campaigns that remind customers to reorder before they run out. Include a direct purchase link to reduce friction.
Upselling and Cross-Selling Tactics That Increase AOV
Product recommendation emails should be personalised based on purchase history. Customers who bought running shoes should receive recommendations for running apparel and accessories. Customers who bought coffee beans should receive recommendations for brewing equipment.
Bundle offers increase average order value by packaging complementary products at a slight discount. Position bundles as curated solutions rather than arbitrary groupings. The narrative matters as much as the discount.
Threshold-based incentives encourage customers to increase cart value to unlock free shipping or gifts. Set your threshold slightly above your current average order value to pull orders upward without giving away margin on purchases that would have occurred anyway.
Customer Experience Improvements That Extend Lifespan
Customer success programmes proactively address common obstacles. If customers typically struggle with product setup, send instructional content immediately after delivery. If customers abandon after their first purchase, trigger engagement campaigns that demonstrate additional use cases.
Loyalty programmes create switching costs that extend customer lifespan. Points-based systems work for transactional brands. Tiered VIP programmes work better for premium brands. The structure matters less than the perceived value of continued participation.
Feedback loops allow customers to signal dissatisfaction before they churn. Post-purchase surveys, review requests, and customer service touchpoints all create opportunities to identify and resolve issues that would otherwise end the relationship.
Customer Segmentation by Lifetime Value
Not all customers deserve equal retention investment. Segment your customer base by actual and predicted CLV, then tailor your retention strategy to each segment's economics.
High-value customers justify concierge-level service. They should receive priority support, exclusive offers, early access to new products, and personalised recommendations. The retention budget per customer can be substantially higher because the LTV justifies the investment.
Mid-tier customers receive automated retention flows with occasional high-touch interventions. The goal is maintaining engagement without excessive manual effort. Well-designed automation can deliver strong results for this segment.
Identifying High-Value Customer Characteristics
Analyse your top 10% of customers by lifetime value. Look for common characteristics: purchase patterns, product preferences, engagement behaviours, acquisition sources, and demographic traits.
These patterns become targeting criteria for acquisition and early lifecycle activation. If high-value customers typically make their second purchase within 30 days, build flows that encourage this behaviour. If they engage heavily with educational content, invest in content production.
Predictive CLV models help identify high-potential customers early in their lifecycle. New customers who exhibit high-value behavioural patterns receive enhanced onboarding and retention touches before they've generated substantial revenue.
Retention Budget Allocation by Segment
Allocate retention spend proportionally to segment value. If your top 20% of customers generate 60% of lifetime value, they should receive more than 20% of your retention budget.
Track retention ROI by segment. Calculate the cost of retention activities (email programme costs, loyalty programme investments, customer success team expenses) and measure the incremental LTV generated. This analysis reveals which segments respond best to retention investments.
Some segments might not justify active retention efforts. One-time bargain hunters who only purchase during deep discounts generate minimal lifetime value. Excluding them from expensive retention programmes improves overall marketing efficiency.
Common CLV Calculation Mistakes Ecommerce Brands Make
The most common mistake is calculating CLV once and never updating it. The timeframe you select dramatically impacts your CLV calculation. Customer behaviour shifts over time, making static calculations increasingly inaccurate.
Many brands confuse customer lifetime value with customer revenue. CLV should represent profit contribution, not gross revenue. Failing to subtract costs leads to overestimating how much you can spend on acquisition and retention.
Another frequent error is using company-wide averages instead of segment-specific calculations. Your business contains multiple customer segments with dramatically different value profiles. Aggregate figures obscure these differences and lead to poor strategic decisions.
Ignoring Customer Acquisition Cost in CLV Analysis
CLV and CAC must be analysed together. A £500 CLV seems impressive until you discover that CAC is £450. The business generates only £50 per customer after recovering acquisition costs.
Calculate both metrics for each acquisition channel. Paid social might deliver £300 CLV customers at £120 CAC. Email list growth might deliver £400 CLV customers at £40 CAC. These economics should drive channel investment decisions.
Track how CAC trends over time. Rising acquisition costs erode the LTV:CAC ratio even if CLV remains stable. When you spot deteriorating ratios, either optimise acquisition efficiency or invest more heavily in retention to increase the lifetime value side of the equation.
Overlooking the Impact of Discount Strategies on CLV
Heavy discounting can artificially inflate purchase frequency whilst destroying profit margins. Customers trained to wait for sales never buy at full price, reducing the actual profit per transaction.
Calculate CLV with and without promotional discounts included. If discounts account for 30% of your revenue, your actual profit per customer is substantially lower than gross revenue figures suggest.
Segment customers by discount sensitivity. Some customers buy regardless of promotions. Others only purchase during sales. Tailor your promotional strategy by segment to maximise CLV rather than maximising transaction volume.
Implementing CLV Tracking in Your Business
Most ecommerce platforms provide basic CLV reporting, but these calculations often use the simple revenue-based formula. Build custom reports that incorporate your actual profit margins and segment-level analysis.
Connect your ecommerce platform to your email marketing platform. Klaviyo allows you to track CLV as a custom property, enabling segment-based flow triggers and campaign targeting based on predicted customer value.
Set up dashboard alerts that notify you when key CLV metrics shift. Track aggregate CLV trends monthly. Monitor segment-level changes weekly. Investigate sudden drops immediately rather than discovering problems months later.
Using CLV Data to Optimise Email Flows
Trigger different flow paths based on predicted CLV. High-value customers receive enhanced welcome sequences with educational content and product recommendations. Lower-predicted-value customers receive efficient automation focused on conversion.
Test retention tactics on high-value segments first. If a new campaign structure increases repeat purchase rates for your best customers, roll it out to other segments. This staged approach minimises risk whilst maximising learning velocity.
Measure how each flow impacts customer lifetime value. Your welcome series should increase 90-day CLV. Your win-back series should recover customers who would otherwise lapse. Track these outcomes systematically rather than measuring email metrics like open rates that don't directly connect to business results.
Building CLV Dashboards That Drive Action
Effective CLV dashboards track the three core drivers: average purchase value, purchase frequency, and customer lifespan. Display aggregate trends alongside segment-level details.
Include leading indicators that predict CLV changes before they appear in the metric itself. Second purchase conversion rate predicts future purchase frequency. Time to second purchase predicts customer lifespan. These early signals allow proactive intervention.
Connect CLV metrics to retention campaign performance. Show which flows increase CLV and by how much. This connection transforms CLV from an interesting metric into an actionable business tool that drives retention strategy decisions.
Make Your Customer Value Growth Inevitable
Customer lifetime value isn't just a metric. It's the financial representation of your customer relationships. When CLV increases, you've built retention systems that keep customers engaged, purchasing frequently, and remaining loyal over years.
Start with accurate calculation using the formula appropriate for your business model. Track the three core drivers: purchase value, frequency, and lifespan. Build retention flows that systematically improve each driver.
The brands that win in ecommerce don't just acquire customers efficiently. They maximise the value of every customer relationship through strategic retention marketing. Calculate your current CLV. Identify the biggest opportunity among the three drivers. Build the flow that addresses that opportunity.
Your customer lifetime value should increase every quarter. If it's stagnant or declining, your retention strategy needs attention. The path forward is clear: optimise your lifecycle flows, personalise your retention campaigns, and make customer value growth inevitable.
Need help building retention flows that actually increase customer lifetime value? At FlowFixer, we specialise in Klaviyo retention strategies for ecommerce brands. We'll audit your current setup, identify the gaps costing you revenue, and build custom flows that drive measurable CLV growth. Get your free Klaviyo audit and discover what's possible when you optimise for customer lifetime value instead of just acquisition.