
Ecommerce KPIs: The Metrics That Actually Matter
Ecommerce KPIs (key performance indicators) are the quantifiable metrics that tell you whether your store is growing, stagnating, or bleeding money. The global average ecommerce conversion rate sits at 2.5%, the average cart abandonment rate is 70.19% according to Baymard Institute's ongoing cart abandonment research, and the top 5% of ecommerce customers generate 35% of total revenue per Smile.io's ecommerce customer loyalty report. Those three numbers alone tell a story most brands aren't reading closely enough.

Most ecommerce founders we work with are tracking something. The problem isn't a lack of data. It's tracking the wrong things, or tracking the right things without knowing what to do when a number moves. This guide fixes that. We'll cover every KPI that actually drives decisions, with formulas, benchmarks, and what to do when your numbers fall short.
What Are Ecommerce KPIs and Why Do They Matter?
Ecommerce KPIs are specific, measurable values that track performance against the goals that keep your store profitable and growing. They translate raw data into decisions.
Without key performance indicators, you're running on instinct. And instinct doesn't scale. The brands that consistently outperform their category aren't guessing at which lever to pull. They're watching a small set of ecommerce KPIs closely, acting fast when something moves, and ignoring the noise.
The case for caring is straightforward. Shopify's global ecommerce statistics report shows ecommerce accounted for approximately 20.5% of global retail sales in 2025. The market is enormous and getting more competitive every quarter. Brands that track the right ecommerce KPIs adapt faster. Those that don't get squeezed.
There's a practical reason to define ecommerce KPIs carefully, too. Not every number in your dashboard is a KPI. Sessions, impressions, add-to-cart events — these are data points. A KPI has a target, an owner, and a review cadence. It connects to a business outcome. That distinction matters enormously when you're deciding where to spend your time.
Leading vs. Lagging Indicators
Ecommerce KPIs split into two types, and mixing them up is one of the most common mistakes we see.
Lagging indicators measure what already happened. Revenue, conversion rate, and average order value (AOV) are lagging. They confirm whether your strategy worked. They're important, but they can't tell you what to fix until after the damage is done.
Leading indicators predict what's coming. Email click-through rate, website traffic volume, and add-to-cart rate are leading. They move before revenue does. If your email click-through drops two weeks in a row, conversion rate will likely follow. Catch it early and you intervene before it shows up in your monthly revenue report.
A well-built KPI dashboard has both. The lagging indicators keep score. The leading indicators tell you which game you're actually playing.
KPIs vs. Metrics: The Practical Difference
A metric is any number you can measure. A KPI is a metric that's tied to a specific goal, with a target and an owner responsible for moving it.
Page views are a metric. Organic traffic growth of 15% month-on-month, owned by your SEO lead, reviewed weekly — that's a KPI. The difference isn't semantic. It's about accountability. When a KPI has no owner, it doesn't improve. It just sits in a report and collects dust.
Keep your core ecommerce KPI list tight. Brands that track 40 key performance indicators typically act on none of them well. Pick 8 to 12, assign owners, and set review cadences. That's the model that produces results.
How to Choose the Right Ecommerce KPIs for Your Business
The right ecommerce KPIs for your store depend on your stage, your business model, and the specific problem you're trying to solve right now.
Most generic KPI lists hand you 50 metrics and call it a day. That's not useful. A brand doing £500k per year has completely different priorities from one doing £10m. The metrics that matter at each stage are different.
Match KPIs to Your Growth Stage
Early-stage stores (under £1m revenue) should focus on a small set of ecommerce KPIs: conversion rate, average order value, and customer acquisition cost. These three tell you whether your offer works, whether your ads are profitable, and whether your store converts. Everything else is distraction.
Growth-stage stores (£1m to £5m) need to add customer lifetime value (CLV) and customer retention rate to the mix. At this stage, repeat purchase economics start to dominate. The cost of acquiring a customer who only buys once starts looking unsustainable.
Scale-stage brands (£5m+) need the full picture: gross margin, inventory turnover, return rate, and Net Promoter Score alongside the core acquisition and retention key performance indicators. At this level, operational efficiency becomes as important as top-line growth.
Use SMART Goals to Anchor Each KPI
Every ecommerce KPI should have a SMART target: Specific, Measurable, Achievable, Relevant, and Time-bound. Without a target, a KPI is just a number.
"Improve conversion rate" is not a KPI. "Increase conversion rate from 1.8% to 2.3% by the end of Q3" is a KPI. The difference is everything. The second version tells you what success looks like, when to check, and by how much you need to move.
Once you've set targets, assign each KPI to one person. Not a team. One person. Shared ownership is no ownership.
Sales KPIs Every Ecommerce Store Should Track
Sales key performance indicators measure whether your store is actually generating revenue efficiently, not just attracting traffic.
These are the metrics that keep founders up at night, and rightly so. But the brands that obsess over revenue without tracking the unit economics underneath it tend to grow into trouble. More sales at the wrong margin just means bigger losses at scale.
Conversion Rate (CR)
Definition: Conversion rate measures the percentage of visitors who complete a purchase.
Formula: CR = (Total Orders / Total Visitors) × 100
Benchmark: The most commonly cited global average ecommerce conversion rate is 2.5%, per Qualimero's ecommerce conversion rate analysis. Most stores fall between 1% and 4%. Top-performing stores in specific categories can reach 5% or higher.
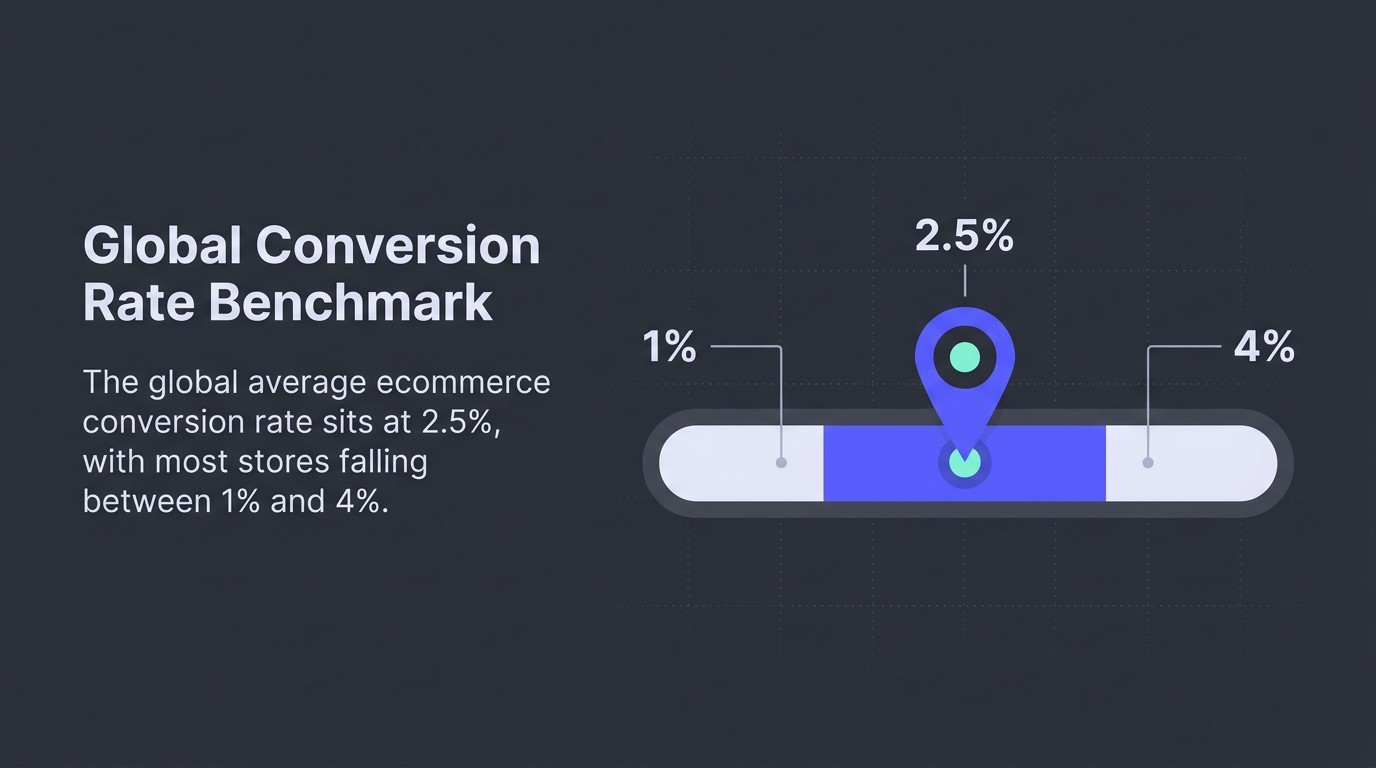
A conversion rate of 1.5% on 50,000 monthly visitors means 750 orders. Push that to 2.5% without touching traffic and you've added 500 orders for free. That's the leverage conversion rate offers.
Improve it: Test your checkout flow first. Most conversion rate losses happen there. Reduce form fields, add trust signals near the buy button, and make sure your mobile checkout doesn't require a PhD to complete. Then look at product pages, specifically your main image quality and how clearly you communicate delivery times.
Average Order Value (AOV)
Definition: Average order value is the mean amount spent per transaction in a given period.
Formula: AOV = Total Revenue / Number of Orders
Benchmark: The global ecommerce AOV was approximately $150 as of October 2025, according to ClickPost's ecommerce average order value research. AOV varies enormously by category, so benchmark against your specific vertical rather than the global figure.
AOV and conversion rate work together. A store with a high conversion rate but low AOV may still underperform on revenue per visitor. The goal is to move both.
Improve it: Introduce a free shipping threshold slightly above your current AOV. If your AOV is £42, set free shipping at £50. Upsells and bundles at checkout are the other reliable lever. Post-purchase email flows that prompt a second purchase within 7 days can also lift effective AOV over time.
Revenue Per Visitor (RPV)
Definition: Revenue per visitor combines conversion rate and AOV into a single number that tells you how much each visitor is worth.
Formula: RPV = Total Revenue / Total Visitors
RPV is the more complete sales KPI because it accounts for both how often people buy and how much they spend. You can have a strong conversion rate and a low AOV and still have a weak RPV. Track all three together.
Improve it: Focus on the levers that move both components simultaneously. Personalised product recommendations lift AOV. Clearer product descriptions and social proof lift conversion rate. Both lift RPV.
Cart Abandonment Rate
Definition: Cart abandonment rate measures the percentage of shoppers who add items to their basket but leave without purchasing.
Formula: Cart Abandonment Rate = (1 - (Completed Purchases / Cart Initiations)) × 100
Benchmark: The global average cart abandonment rate is 70.19% to 70.22%, per Baymard Institute's ongoing research. Most ecommerce stores lose more than two-thirds of potential buyers at this stage. It's one of the most expensive leaks in any store.
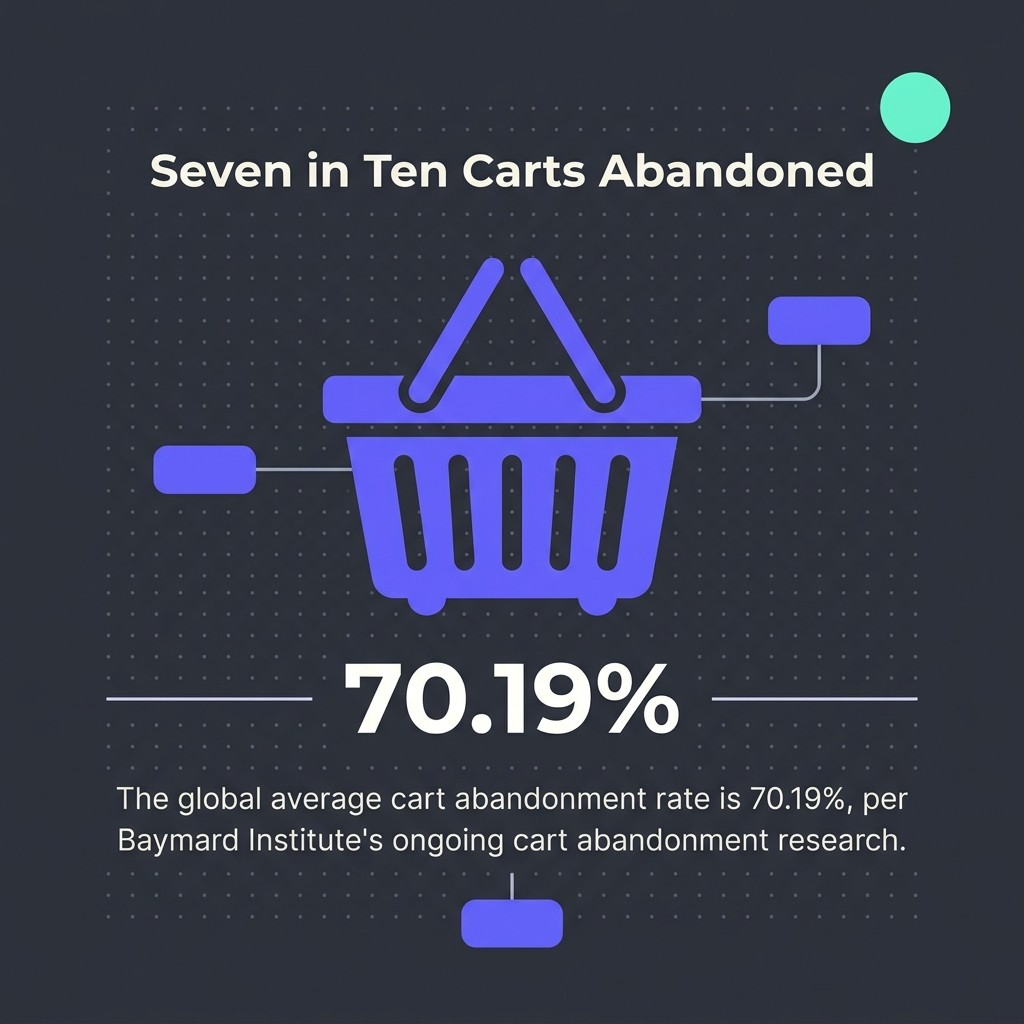
A cart abandonment rate of 70% sounds alarming until you realise it's the global average. The real question is whether yours is above or below that, and what's causing it.
Improve it: An automated abandoned cart email flow is the single fastest win here. A well-structured three-email sequence sent within 1, 24, and 72 hours of abandonment can recover a significant share of lost revenue. Our abandoned cart flow strategies guide covers exactly how to build one that actually converts. Beyond flows, look at your checkout for friction: unexpected delivery costs, forced account creation, and slow page load are the three most common culprits.
Monthly Sales Growth Rate
Definition: Monthly sales growth rate measures the percentage change in revenue from one month to the next.
Formula: Growth Rate = ((This Month's Revenue - Last Month's Revenue) / Last Month's Revenue) × 100
This KPI tells you the direction of travel, not just where you are. A store doing £100k per month with 10% month-on-month growth is in a very different position from one doing £200k flat for six months. Track both the absolute number and the growth rate.
Marketing KPIs to Measure Acquisition and Ad Performance
Marketing key performance indicators tell you whether you're acquiring customers profitably and which channels are actually driving growth.
This is where most ecommerce brands waste money. Not because they're tracking nothing, but because they're tracking the wrong things. Impressions and reach feel good. Customer acquisition cost and return on ad spend tell you whether the budget is working.
Customer Acquisition Cost (CAC)
Definition: Customer acquisition cost is the total marketing and sales spend required to acquire one new customer.
Formula: CAC = Total Marketing and Sales Spend / Number of New Customers Acquired
Benchmark: Average ecommerce CAC sits around $78 across all categories, according to Upcounting's ecommerce customer acquisition cost analysis. This varies significantly by category. Fashion and apparel tend to run higher. Consumables and subscriptions often justify a higher CAC because repeat purchase rates support it.
CAC on its own is meaningless. You need to compare it against customer lifetime value (CLV). A £78 CAC is excellent if your CLV is £400. It's catastrophic if your CLV is £60.
Improve it: Retention is the most underrated lever for reducing CAC. When your repeat purchase rate rises, each acquisition cost is spread across more orders. Email flows that drive second and third purchases change the maths on every customer you acquire. That's why we're obsessed with retention, not just acquisition.
Return on Ad Spend (ROAS)
Definition: Return on ad spend measures the revenue generated for every £1 spent on advertising.
Formula: ROAS = Revenue from Ads / Ad Spend
A ROAS of 4 means you're generating £4 in revenue for every £1 spent. Whether that's profitable depends on your gross margin. A 4x ROAS on a 20% margin product is barely breaking even. The same ROAS on a 60% margin product is excellent. Always read ROAS alongside gross margin.
Improve it: Test your landing pages before your ad creative. Most brands iterate endlessly on creative and send traffic to a product page that hasn't been touched in two years. A better landing page lifts ROAS across all ad channels simultaneously. Then segment by audience and cut any audience where ROAS has been below your threshold for 30 days running.
Website Traffic and Traffic Sources
Definition: Website traffic measures the total number of sessions or users visiting your store, broken down by the channels driving them.
Traffic sources are where this ecommerce KPI earns its place. Total traffic is a lagging indicator. Traffic by source is a leading one. If organic traffic drops while paid traffic holds, you have an SEO problem. If direct traffic drops, you have a brand recall problem. Channel-level data is where the actionable insight lives.
The main traffic sources to track are organic search, paid search, paid social, direct, email, and referral. Each tells a different story about your marketing mix and where you're exposed if a channel underperforms.
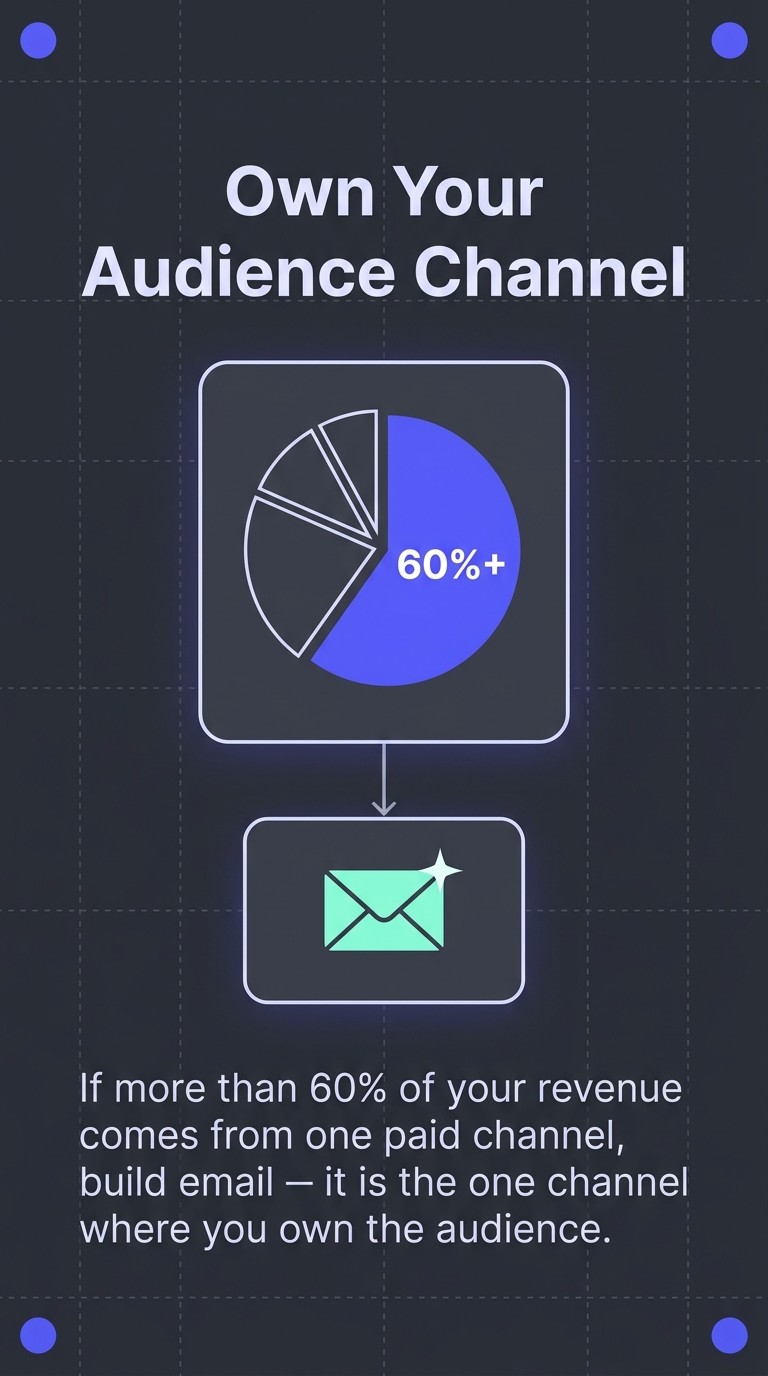
Improve it: Build a traffic diversification target. If more than 60% of your revenue comes from one paid channel, you're one algorithm change away from a bad quarter. Email is the channel most brands underinvest in relative to the return it delivers, and it's the one channel where you own the audience. Our complete guide to email marketing for ecommerce covers how to build that channel properly.
Bounce Rate
Definition: Bounce rate measures the percentage of visitors who land on a page and leave without taking any further action.
Formula: Bounce Rate = (Single-Page Sessions / Total Sessions) × 100
Bounce rate means different things depending on the page type. A high bounce rate on a blog post can be fine if the post answered the question. A high bounce rate on a product page is a problem. Always segment bounce rate by page type before drawing conclusions.
Improve it: For product pages, the three biggest bounce drivers are slow page speed, poor mobile layout, and a mismatch between the ad that sent the visitor and what they find when they arrive. Fix the message match first. It's the quickest win.
Customer Experience and Retention KPIs
Customer experience and retention key performance indicators measure how well you're holding on to the customers you've already paid to acquire, and how those customers feel about your brand.
This section sits at the heart of everything we do at FlowFixer. Acquiring a customer once and never seeing them again isn't a business. It's a very expensive transaction. The brands that make retention inevitable are the ones that compound.
Customer Lifetime Value (CLV)
Definition: Customer lifetime value is the total revenue a customer generates across their entire relationship with your brand.
Formula: CLV = Average Order Value × Purchase Frequency × Average Customer Lifespan
CLV is the most important ecommerce KPI for any brand focused on sustainable growth. It's the number that determines how much you can afford to spend acquiring a customer (your CAC ceiling) and how much untapped revenue is sitting in your existing customer base.
Once you have a CLV figure, the strategic questions become much clearer. Should you raise your paid advertising budget? Can you afford a loss-leader first purchase? Is your post-purchase email sequence doing its job? CLV gives you the context to answer all of them. Our deep-dive on how to calculate and improve customer lifetime value covers the full methodology.
Improve it: Post-purchase email flows are the fastest lever for CLV. A well-timed replenishment email, a cross-sell recommendation 30 days after purchase, and a loyalty milestone email at 90 days can each add meaningful repeat purchase volume. Stack them properly and CLV moves in ways that compound over time.
Customer Retention Rate and Churn Rate
Definition: Customer retention rate measures the percentage of customers who make more than one purchase in a given period. Churn rate is its inverse.
Formula: Retention Rate = ((Customers at End of Period - New Customers) / Customers at Start of Period) × 100
Formula: Churn Rate = 100% - Retention Rate
Benchmark: Most ecommerce stores retain only 15% to 43% of their customers, per MobiLoud's ecommerce retention research. That's a wide range. Where you fall within it depends heavily on your category and average repurchase cycle.

A retention rate of 30% might be healthy for a high-end furniture brand where customers buy infrequently. It's poor for a skincare brand selling a product customers need every 8 weeks. Always contextualise this KPI against your typical repurchase window.
Improve it: The first 90 days after acquisition determine whether a customer becomes a repeat buyer. If your post-purchase flow ends after one "thank you" email, you're leaving most of that retention potential untapped. Our Klaviyo retention playbook for ecommerce covers how to structure those 90 days properly.
Net Promoter Score (NPS)
Definition: Net Promoter Score measures customer loyalty by asking how likely customers are to recommend your brand to others, on a scale of 0 to 10.
Formula: NPS = % Promoters (score 9-10) - % Detractors (score 0-6)
NPS scores range from -100 to +100. An NPS above 0 is acceptable. Above 50 is strong. Above 70 is exceptional.
NPS is a leading indicator for word-of-mouth growth. A rising NPS typically precedes an increase in referral traffic and organic growth. A falling NPS is an early warning sign that your customer experience has a problem that revenue figures haven't reflected yet.
Improve it: Survey customers at the right moment. Post-delivery is standard, but many brands get stronger signal by surveying at the 90-day mark, after customers have had time to actually use the product. Then close the loop on detractors personally. One conversation with a dissatisfied customer teaches you more than 100 five-star reviews.
Customer Satisfaction Score (CSAT)
Definition: Customer satisfaction score measures how satisfied a customer is with a specific interaction or experience, typically scored 1 to 5 or 1 to 10.
Formula: CSAT = (Number of Satisfied Customers / Total Survey Responses) × 100
Where NPS measures overall brand loyalty, CSAT measures satisfaction at a specific touchpoint. Use CSAT to evaluate individual interactions: a customer service resolution, a returns experience, a specific product. Together, CSAT and NPS give you both the moment-level and relationship-level view of your customer experience.
Improve it: Trigger CSAT surveys immediately after the interaction you're measuring. Delay kills response rates and introduces recall bias. Keep the survey to one or two questions.
Operations and Finance KPIs for Ecommerce
Operations and finance key performance indicators measure the efficiency and profitability of your ecommerce store at the unit level, not just the top line.
Revenue is a vanity metric if you don't know your margins. We've seen ecommerce brands growing 40% year-on-year whilst quietly destroying their own profitability. Operations KPIs are where that problem shows up first, before it reaches the P&L.
Gross Margin
Definition: Gross margin measures the percentage of revenue remaining after subtracting the cost of goods sold.
Formula: Gross Margin = ((Revenue - Cost of Goods Sold) / Revenue) × 100
Gross margin determines whether your business model is viable. It sets the ceiling for every other investment you make in marketing, retention, and operations. A 20% gross margin leaves very little room to acquire customers, run promotions, and still be profitable. A 60% gross margin changes what's possible across the entire business.
Improve it: Raise AOV before cutting costs. Bundling and upselling the same customer into higher-value orders improves effective margin without renegotiating with suppliers. Then review your returns rate. Returns eat margin fast, and they're often a product quality or expectation-management problem that's fixable.
Inventory Turnover Rate
Definition: Inventory turnover rate measures how many times a store sells and replaces its inventory in a given period.
Formula: Inventory Turnover = Cost of Goods Sold / Average Inventory Value
Low inventory turnover means capital tied up in stock that isn't selling. High turnover means you're selling efficiently but risks stockouts on popular lines. The right rate depends on your category. Fashion brands typically target higher turnover than homewares brands, for example.
Improve it: Use your email list to move slow-moving stock before it becomes a clearance problem. A targeted campaign to customers who've browsed a specific category, built through proper email segmentation, can shift inventory at full or near-full margin. Our guide on email segmentation strategies that actually work covers exactly how to build those audiences.
Return Rate
Definition: Return rate measures the percentage of orders that are returned by customers.
Formula: Return Rate = (Number of Returns / Total Orders) × 100
Return rate varies enormously by category. Fashion and footwear typically see the highest rates. Electronics and consumables tend to be lower. The benchmark that matters is your own historical rate, and whether it's trending up or down.
A rising return rate almost always signals a product quality issue, a sizing or expectation mismatch, or a fulfilment problem. Fix the root cause, not the symptom.
Order Fulfilment Time
Definition: Order fulfilment time measures the average time from order placement to delivery.
Fulfilment time is a customer satisfaction KPI as much as an operations one. Customers form expectations based on what you promise at checkout. If actual delivery time consistently exceeds the promised window, CSAT and NPS suffer before you've even noticed the operational problem.
Improve it: Set clear delivery expectations at checkout and in your order confirmation email. Then track actual vs. promised delivery times weekly. The gap between those two numbers is your fulfilment problem in its simplest form.
How to Build an Ecommerce KPI Dashboard and Review Cadence
An ecommerce KPI dashboard is only as useful as the habits around it. The goal isn't a perfect dashboard. The goal is a review cadence that produces decisions.
We see this go wrong all the time. A brand builds a beautiful Looker Studio dashboard with 35 charts, reviews it once at the end of the month, and wonders why their metrics don't improve. The dashboard isn't the problem. The cadence is.
Choose Your Tools
For most ecommerce brands, a practical KPI dashboard stack looks like this:
- Google Analytics 4 for website traffic, traffic sources, conversion rate, bounce rate, and session data
- Klaviyo for email and SMS KPIs including revenue per recipient, click-through rate, and flow performance
- Your ecommerce platform (Shopify, WooCommerce, or similar) for sales KPIs including AOV, revenue, and order volume
- Looker Studio for pulling everything into a single view if you're working across multiple platforms
Start with the tools you already have. A GA4 report reviewed weekly is more valuable than a custom data warehouse that takes six months to build and nobody opens.
Set Your Review Cadence
Different ecommerce KPIs need different review frequencies. Here's the structure that works across the brands we support:
Daily: Revenue vs. target, ad spend vs. budget, email send performance (open rate, click-through rate, revenue). These are your pulse metrics. A quick 10-minute check each morning tells you if anything needs immediate attention.
Weekly: Conversion rate, AOV, cart abandonment rate, traffic by source, and ROAS by channel. Weekly data smooths out day-to-day noise while still giving you enough frequency to catch problems early.
Monthly: CAC, CLV, customer retention rate, gross margin, return rate, and NPS. These key performance indicators move more slowly and need a full month of data to be meaningful. Monthly reviews are where strategic decisions happen.
Quarterly: Full P&L review, inventory turnover, and a full KPI audit. Ask whether your current set of ecommerce KPIs still matches your current business goals. The metrics that mattered most at £500k may not be the right ones at £2m.
Act on What You Find
A KPI review without a decision attached is just a meeting. At the end of every weekly review, write one sentence for each metric that's off-target: what changed, what you'll do about it, and when you'll check again.
That discipline, more than any dashboard feature, is what separates ecommerce brands that improve from those that just measure. Obsessing over results, not tasks, means every KPI review ends with a concrete next action. Not a note to "monitor closely". An action.
If you want to audit how your current Klaviyo setup is performing against these key performance indicators, our guide to optimising for results in Klaviyo, not just tasks shows you exactly where to look first.
Quick-Reference Ecommerce KPI Index
The following table summarises the core ecommerce KPIs covered in this guide, with formulas and benchmarks where mapped research supports them.

Track Fewer KPIs, Act on All of Them
The ecommerce brands that win aren't tracking more metrics. They're acting on fewer, faster, and more consistently.
Most of the ecommerce KPIs in this guide fall into one of two buckets: acquisition economics (conversion rate, CAC, ROAS, AOV) and retention economics (CLV, retention rate, NPS, cart abandonment rate). Get both right and the maths of building a profitable ecommerce brand becomes significantly simpler.
The next practical step is to audit what you're currently measuring against what you should be. Pick 8 to 12 ecommerce KPIs from this guide that match your current stage. Set a target for each. Assign an owner. Build a weekly review habit and a monthly strategic review. That framework alone puts you ahead of most brands in your category.
If your retention metrics are the weak point, that's exactly where we focus. FlowFixer works across the entire customer lifecycle, turning one-time buyers into repeat customers through Klaviyo email and SMS flows built around your specific key performance indicators, not generic benchmarks. Ready to make retention inevitable? See how our Klaviyo revenue optimisation service works and find out what your numbers could look like.
.jpg)
.jpg)